‘Ring of Fire’ May Bring Floods and Extreme Weather to Illinois
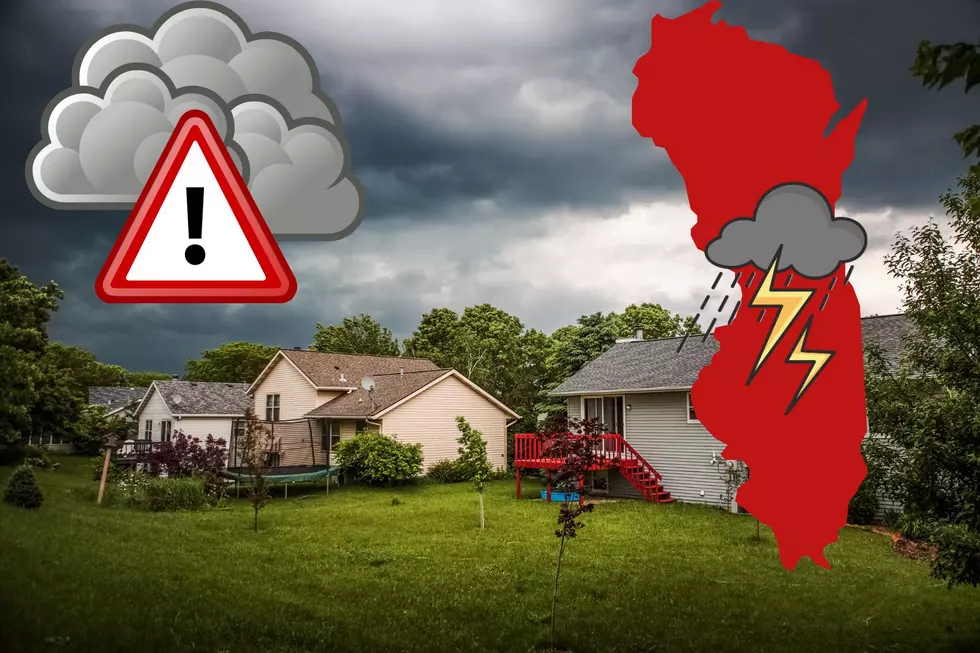
What meteorologists are calling a "ring of fire pattern" is expected to bring some weather extremes to parts of Illinois before the end of this week.
What is a 'Ring of Fire' Pattern?
According to the Weather Channel, the 'ring of fire' pattern is a cluster of thunderstorms "riding around the northern edge of a heat dome of high pressure camped over the Southern Plains."
There's an elevated risk of flooding when there's a ring of fire pattern, and it often can create intense derechos which are "fast-moving windstorms and sometimes thunderstorms that moves across a great distance and is characterized by damaging winds."
What will Illinois Weather Be Like Because of 'Ring of Fire'
According to the Weather Channel, there are a few chances of heavy rain causing flooding this week.
On Wednesday (8/2) the forecast says it's "likely" that there will be flooding in the southwestern edge of Illinois, and at least a marginal chance of storms and flooding for the southwestern half of the state.
The flooding is expected to be late on Wednesday night and into Thursday morning (8/4).
Cooler Temperatures Headed Our Way?
High temperatures are still expected to be in the mid to upper 80s through Friday (8/5), and then there's a chance to rain on Saturday with highs in the mid-80s.
Lower 80s to Upper 70s will be the norm beginning Sunday when the high is supposed to be around 80.
LOOK: The most expensive weather and climate disasters in recent decades
LOOK: The most extreme temperatures in the history of every state
More From Rockford's New Country Q98.5


